Mobility and Mental Health of Older People with Vision Loss
Aging into low vision or blindness creates an important intersection in life, where transportation methods are often impacted, as well as economic impacts, access to ongoing healthcare, and other areas of community life. The following data are reported stratified by age band to begin to understand the impacts of aging and vision loss.
The table below shows types of daily task difficulties within each age band. The first percentage is from within people who have trouble seeing, and the second percentage (in parenthesis) is the sighted population’s percentage. As you will see by the percentages, people who have difficulty seeing are more likely to have difficulty getting around their community. The percentages of difficulty with getting around increase with age band as well.
| Difficulty Walking or Climbing Stairs | Uses a Cane or Walker | Wheelchair or Scooter | Person Assist | |
|---|---|---|---|---|
| 55-64 | 40.7% (20.6%) | 10.1% (4.8%) | 4.2% (1.4%) | 5.9% (2.1%) |
| 65-74 | 52.3% (28%) | 19.2% (9.1%) | 7.3% (2.3%) | 10.1% (3.7%) |
| 75-84 | 64.9% (39.3%) | 35.2% (17.9%) | 14.4% (4.7%) | 21.9% (7.7%) |
| 85-94 | 79.9% (61.8%) | 59.7% (44.8%) | 18.8% (13.3%) | 38.9% (22.5%) |
| All Older Adults | 52.5% (29%) | 22.1% (11%) | 8.4% (3%) | 13.2% (4.8%) |
| First Percentage = People who have trouble seeing Second Percentage (In Parenthesis) = Sighted population |
||||
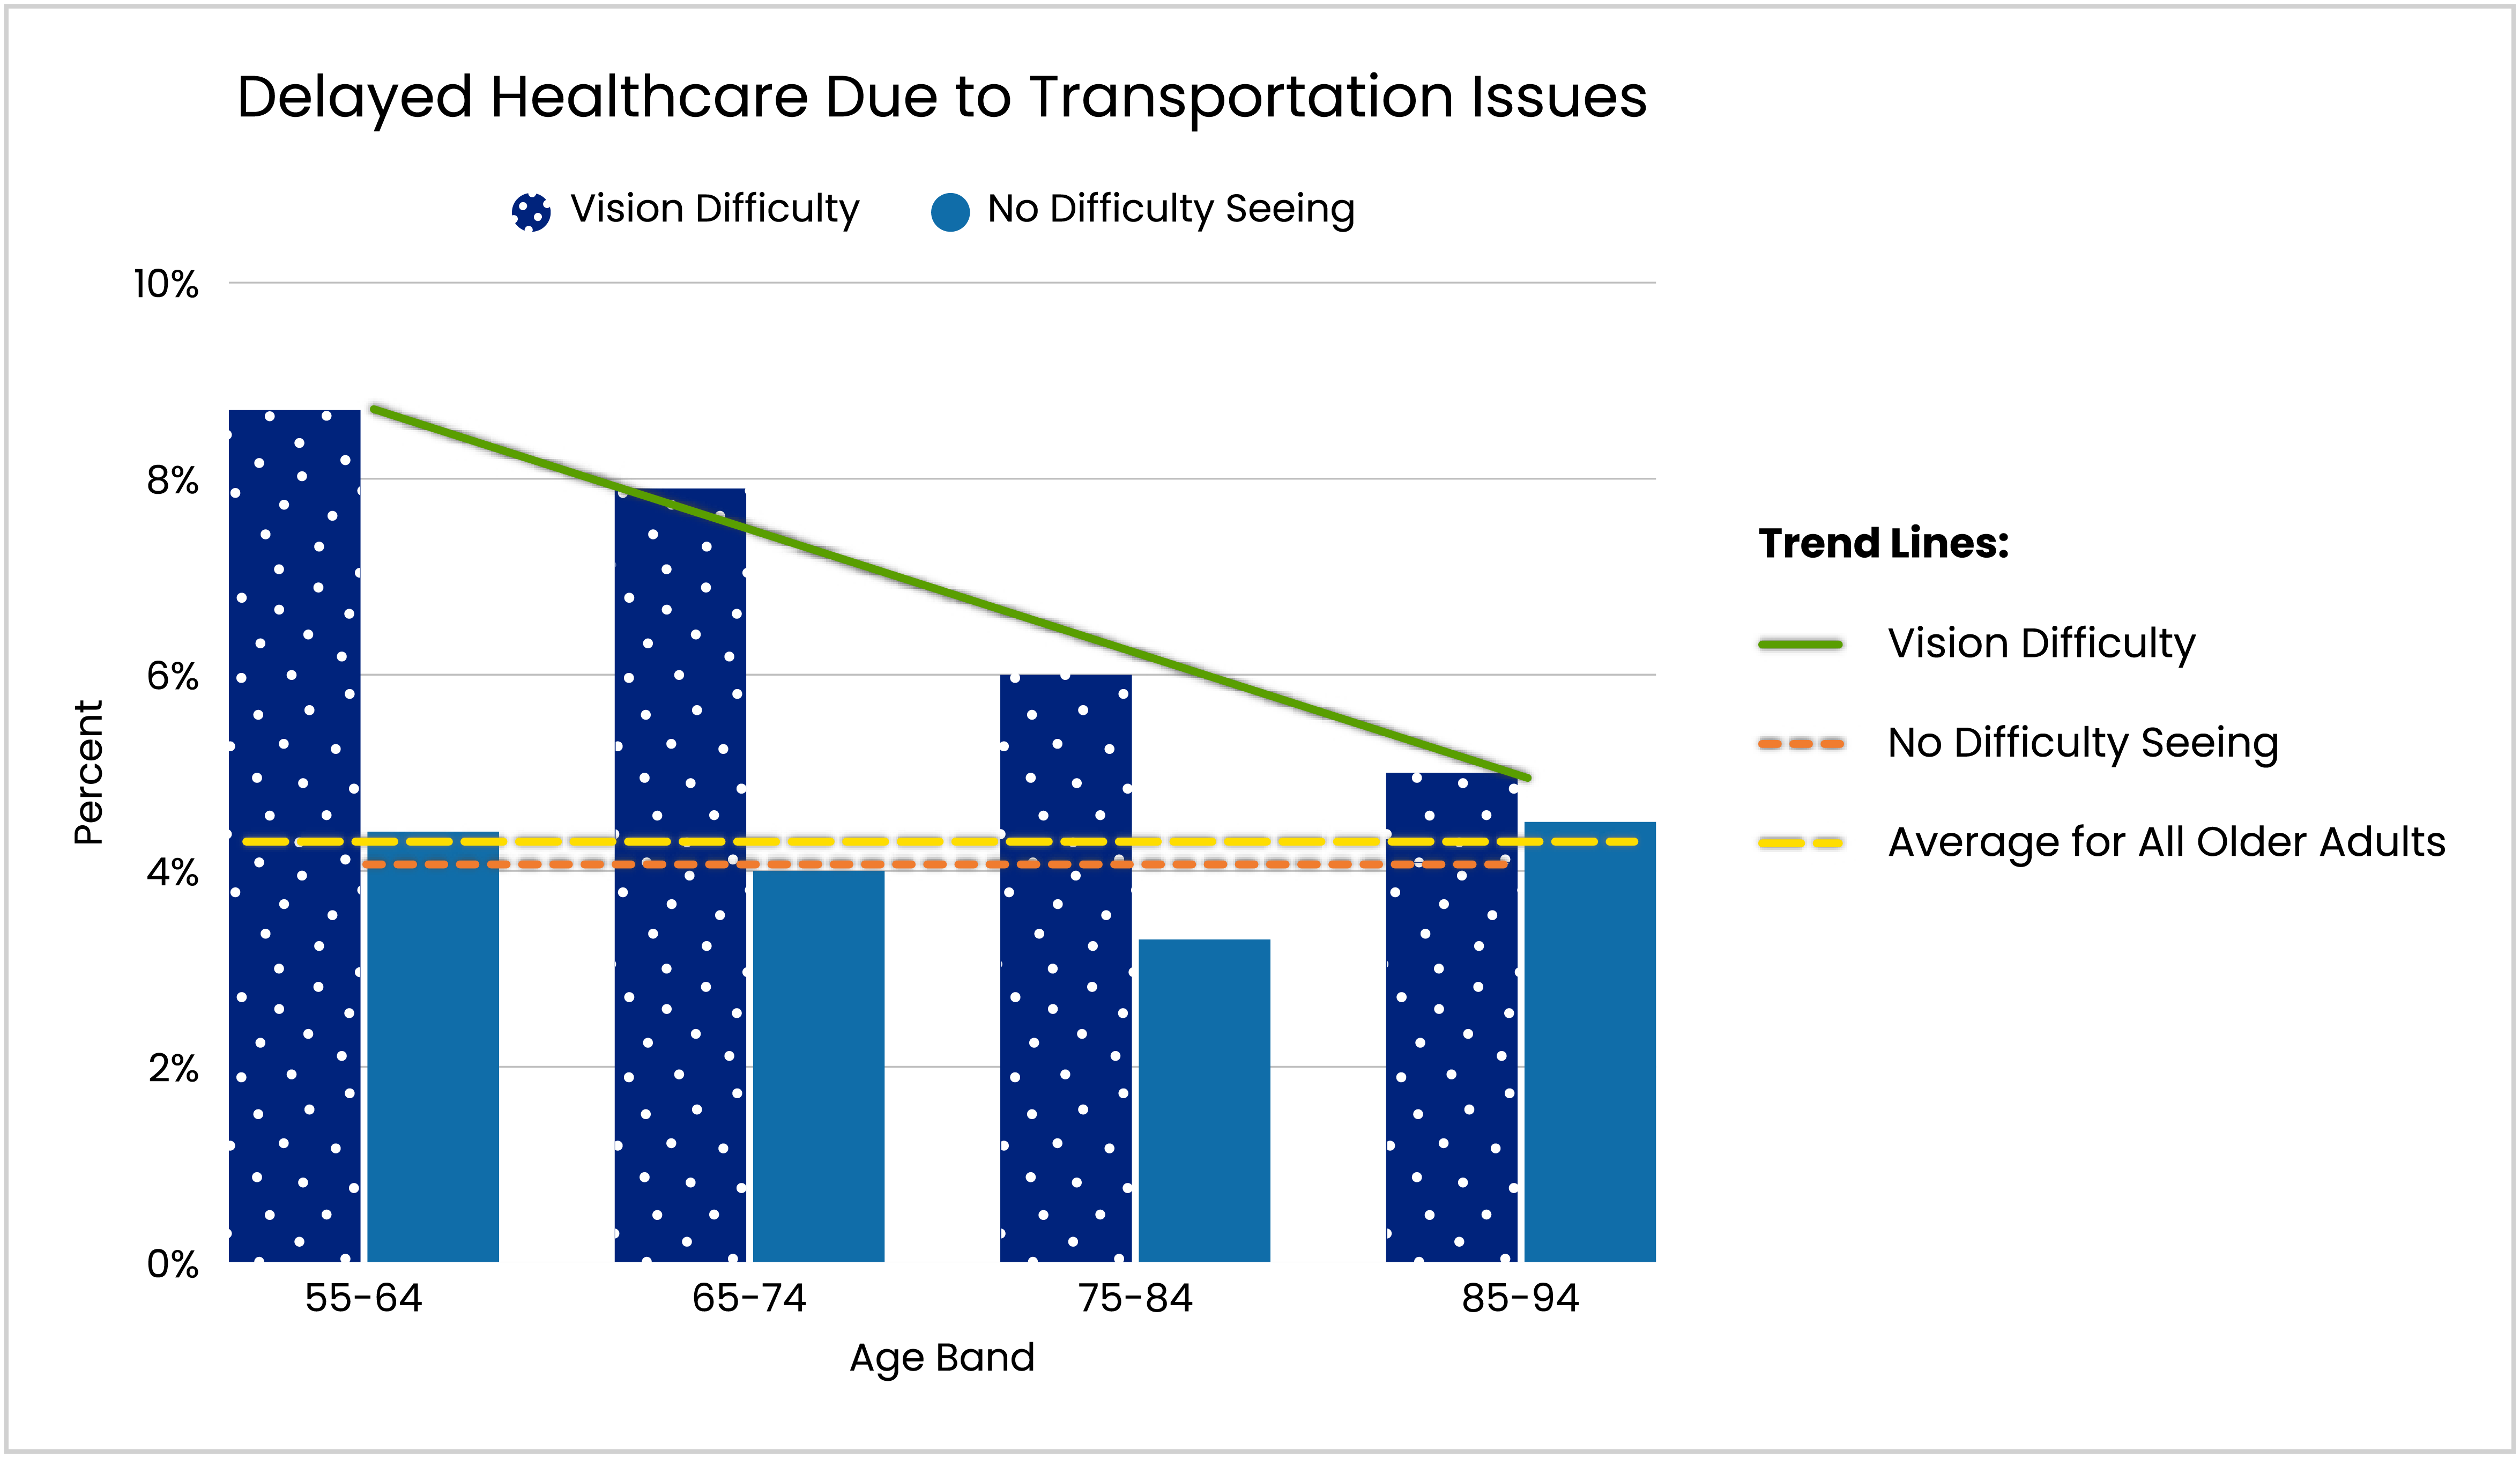
As people with vision difficulty get older, their odds of delaying healthcare due to transportation decrease. This results in the gap in healthcare access that stems from transportation access diminishing between the people with and without vision difficulty, and disappearing by age 85+.
Mental health, vision loss, and aging
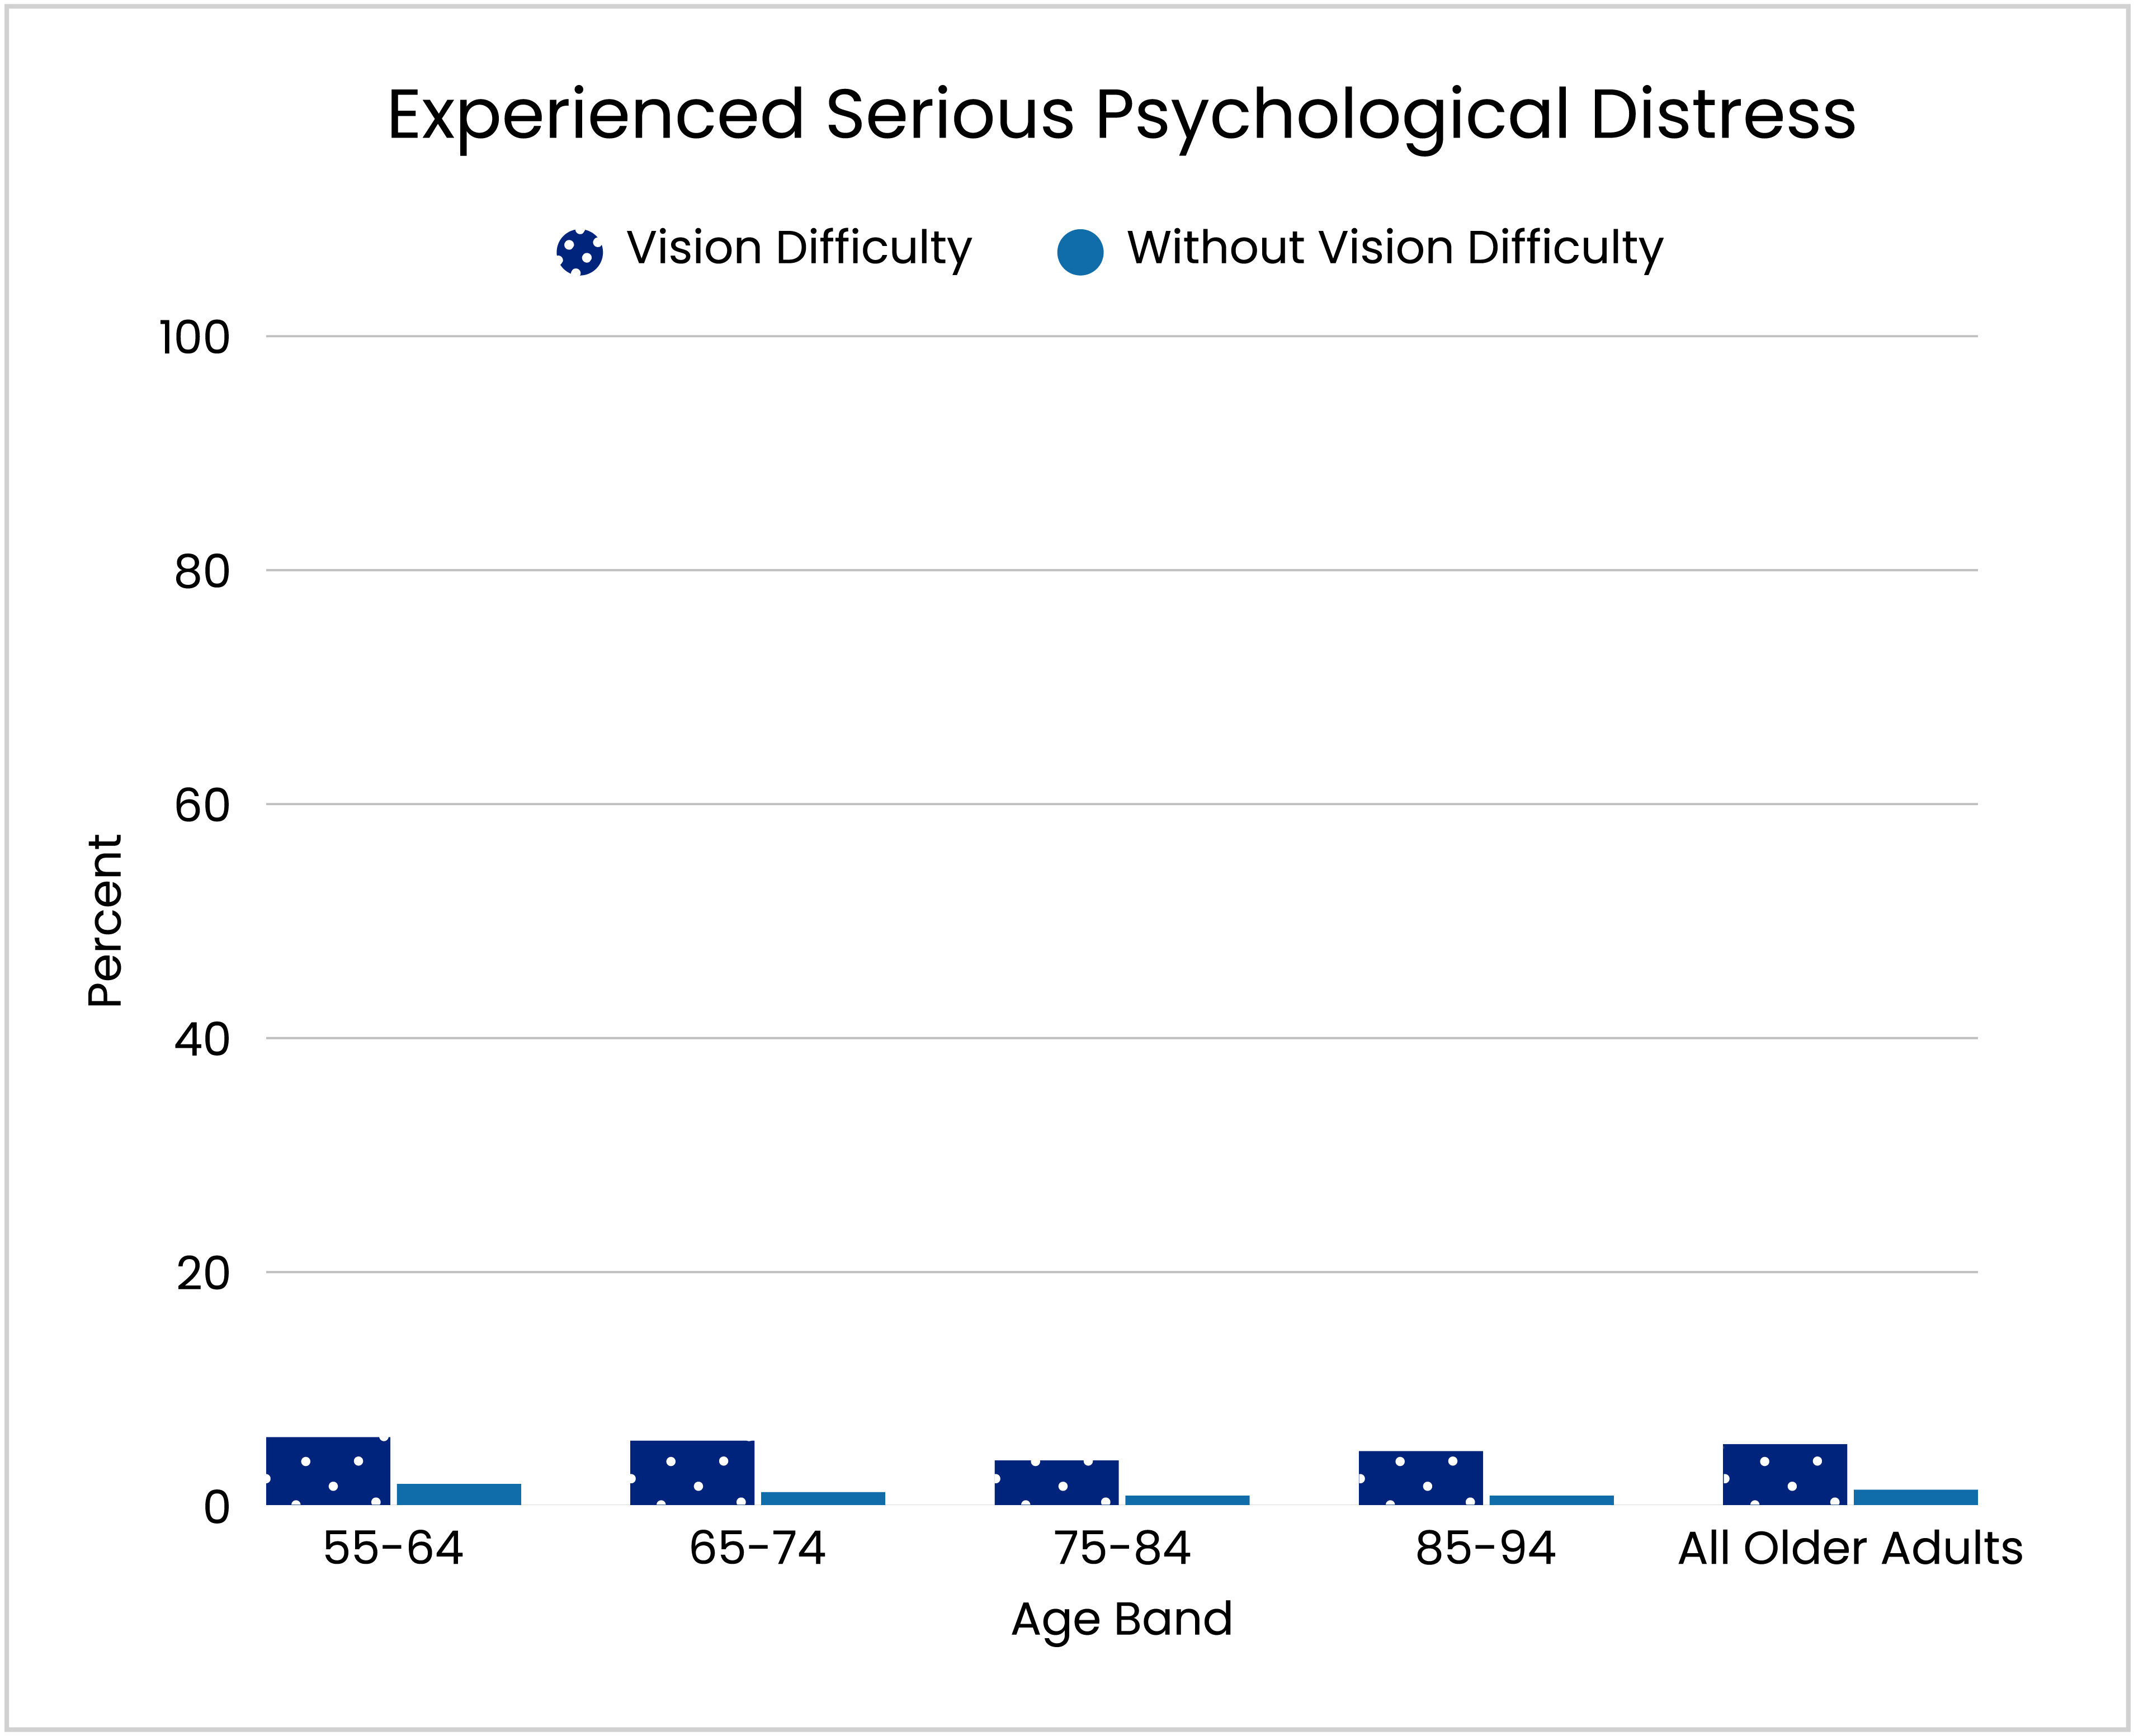
The table below presents mental health indicators by age band for people who report difficulty seeing and those without vision difficulty. The first percentage reflects the rate among people with difficulty seeing, and the second percentage in parentheses reflects the rate among the sighted population. Across nearly all age groups, people with vision difficulty report poorer mental health outcomes than their sighted peers. The size of this gap varies by age band, with some indicators showing the largest disparities in younger and middle adulthood and others remaining elevated into later life. In general, mental health challenges become less common with age in both groups, although people with vision difficulty continue to experience higher rates than the sighted population throughout most of the lifespan.
| Vision Difficulty and Experienced Serious Psychological Distress (%) | Sighted and Experienced Serious Psychological Distress (%) | |
|---|---|---|
| 55-64 | 5.9 | 1.9 |
| 65-74 | 5.6 | 1.2 |
| 75-84 | 3.9 | 0.9 |
| 85-94 | 4.7 | 0.9 |
| All Older Adults | 5.3 | 1.4 |
Note that while serious psychological distress is reported more frequently by people who have difficulty seeing than people who have no difficulty seeing, it is still an uncommon response. It is important to keep in perspective that it is uncommon for people who are blind or low vision to have serious psychological distress.
The following table shows the rate at which people with difficulty seeing (and those without) reported various markers of psychological distress. Responses here indicate always, often, or a little of the time.
| Felt hopeless | Everything was an effort | Felt restless | Felt nervous | Difficulty in social activities | |
|---|---|---|---|---|---|
| 55-64 | 19.5 (9.3) | 38 (20.7) | 45.5 (28.9) | 51.5 (32.6) | 19.8 (7.2) |
| 65-74 | 17.1 (6.8) | 32.5 (17.9) | 38.3 (24.3) | 46.1 (28.8) | 20.6 (7.6) |
| 75-84 | 17.4 (6.0) | 38.9 (18.5) | 38.5 (23.1) | 44.6 (29.5) | 32.6 (10.9) |
| 85-94 | 18.5 (6.4) | 41 (23.7) | 32.4 (21.8) | 35.9 (27) | 52.9 (29) |
| All Older Adults | 18.3 (7.7) | 36.6 (19.5) | 40.7 (25.8) | 47.1 (30.4) | 25.3 (9.3) |
Positive measures of mental health:
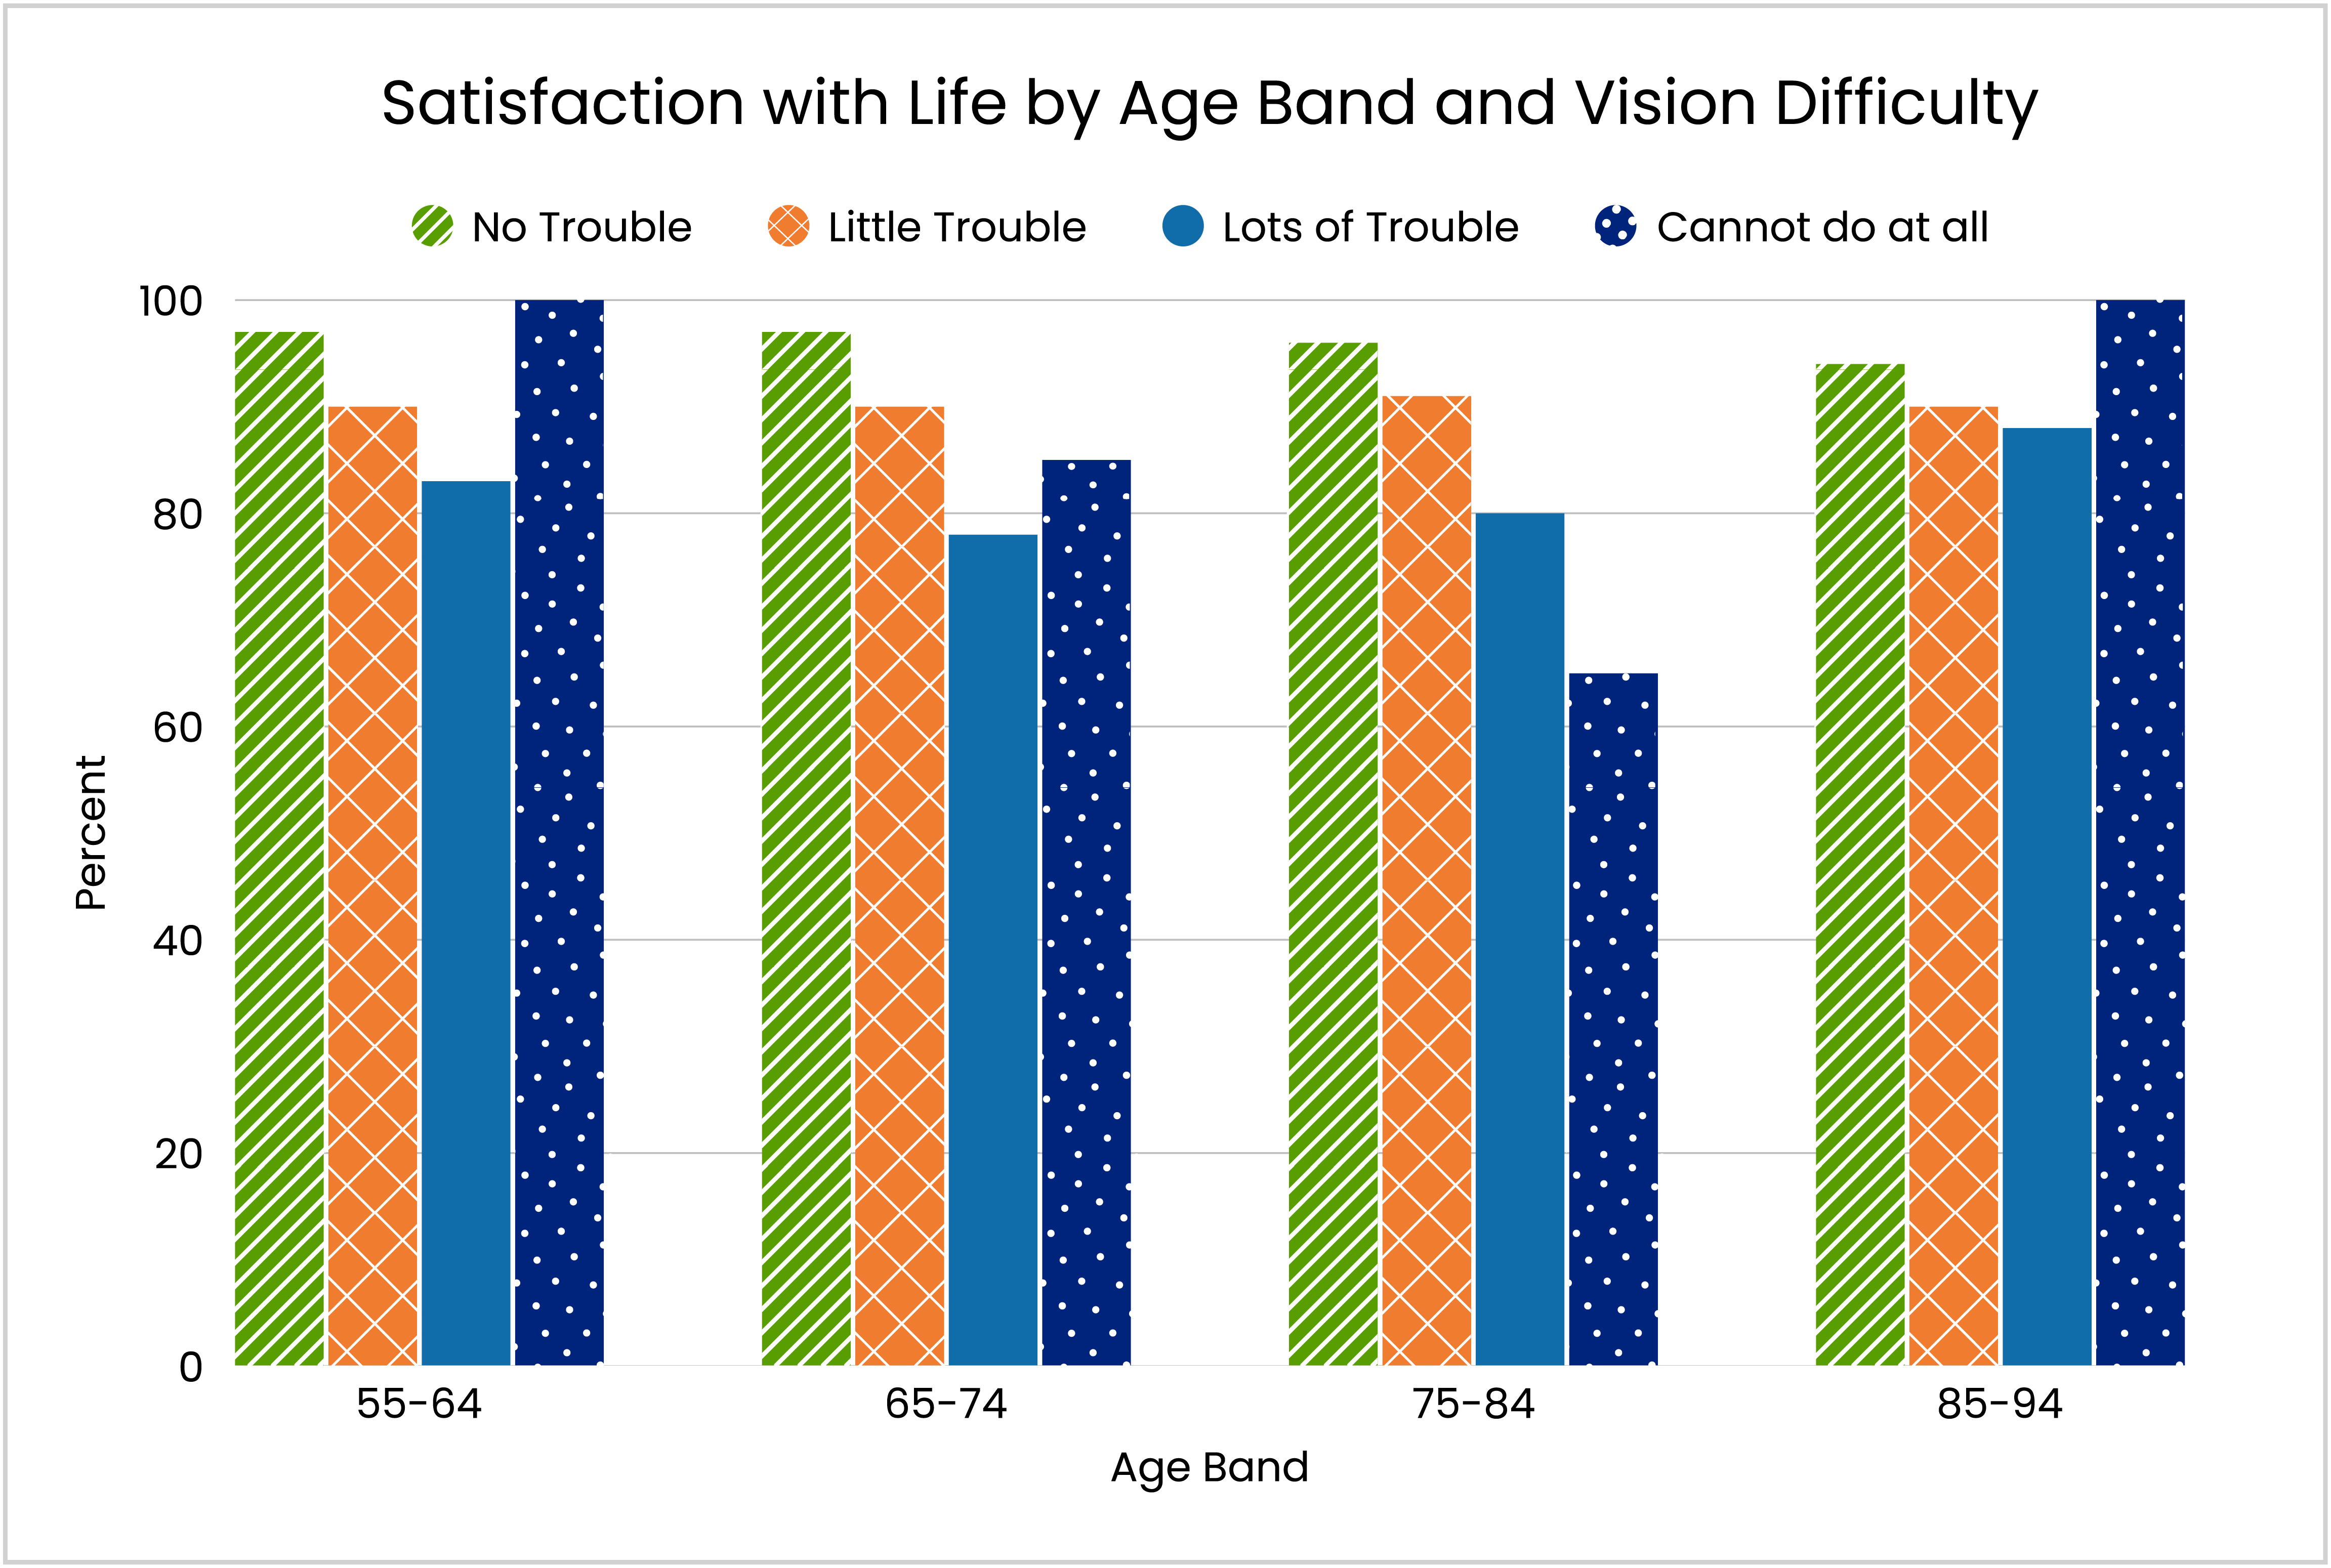
Older adults without vision loss tend to be slightly more satisfied with life than older adults with some degree of vision difficulty, including those with very mild vision difficulty. However, if disaggregating the group of people who have vision difficulty, it is interesting to note that people who report “cannot see at all” are most satisfied with life – more so than people who have a lot of difficulty seeing, especially at the 55-65 year old age band, corresponding to a point in time and level of vision loss where a person would most likely have access to services to learn non-visual strategies.
Overall, older adults are highly satisfied with life, and very stable in that outlook. People, both with vision difficulties, get emotional support slightly more often with age, eventually closing the gap with older adults without vision difficulty.
| Satisfied with life | Got emotional support frequently | |
|---|---|---|
| 55-64 | 90.1 (96.5) | 68.1 (77.8) |
| 65-74 | 89.6 (97.2) | 71.5 (80.4) |
| 75-84 | 89.7 (96.4) | 73.5 (81.2) |
| 85-94 | 90.2 (94.3) | 77.6 (78.6) |
| All Older Adults | 89.9 (96.6) | 71.0 (79.4) |
Data Source: The NHIS data shared on this website were obtained through the IPUMS NHIS database:
Lynn A. Blewett, Julia A. Rivera Drew, Andrew Fenelon, Miriam L. King, Kari C.W. Williams, Daniel Backman, Etienne Breton, Grace Cooper, and Stephanie Richards. IPUMS Health Surveys: National Health Interview Survey Version 8.1 [dataset]. Minneapolis, MN: IPUMS, 2025.
For more detailed information, you can refer to the CDC's National Center for Health Statistics citation page here.
For state level data at the intersection of aging and vision loss, see the following resources from our partners at the Center for Research on Disability Compilation and Expansion B: Statistics on the Blind and Low Vision Ages 55+ Population - Compendium (2026) | Center for Research on Disability