Flatten Inaccessibility: Technology Usage
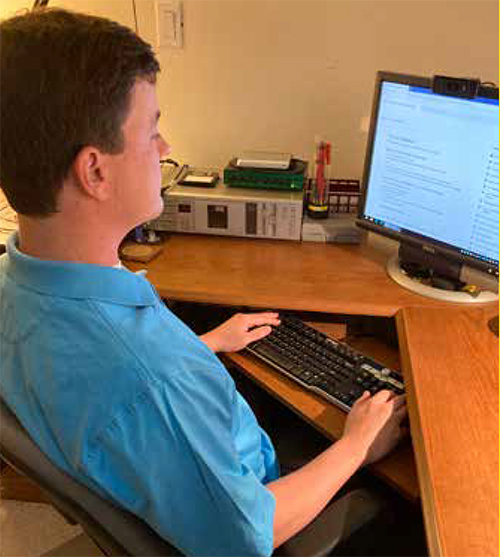
[I]nstead of face-to-face learning, I'm doing it online, which cuts out my need to commute on the city bus to school and back. My computer and iPhone cover that gap by allowing access to my classes.
—Congenitally VI White female, aged 25 to 34 years, with no additional disabilities
The participants had access to technology, as evidenced by the 1,771 (92%) who reported using smartphones. In addition, only 138 (7%) of the participants indicated needing assistance to complete the online survey. Eighteen (<1%) participants reported they had obtained their smartphone because of the COVID-19 pandemic.
Internet access was available to 1,781 (93%) of 1,907 participants who had Internet access prior to the COVID-19 pandemic. Twelve (<1%) participants did not have Internet at home prior to COVID-19 but had obtained it, 10 (<1%) participants reported they canceled their Internet access due to COVID-19, whereas 58 (3%) reported they only had Internet on their smartphones. Yet, access to the Internet and a smartphone was no guarantee of access to information. Apps, websites, graphics on news sites, and documents are often not accessible to those who are visually impaired.
Participants repeatedly shared their frustrations with their lack of access to specific information about COVID-19, in addition to challenges with technology tools used to access other health-related information, transportation, shopping, employment, socializing, education, and voting. Specific technology challenges in these areas are discussed in those corresponding sections of this report.
Participants provided their level of agreement to two concern statements.5
I am concerned that visual information about the COVID-19 pandemic is being shown on the television and that this information is not accessible to me. (n=1,692, M=3.51, SD=1.23
As a result of the COVID-19 pandemic, I have increased my use of apps designed to connect people with visual impairments with sighted assistance (e.g., Aira, Be My Eyes). (n=1,542, M=2.77, SD=1.20)
Participants were asked to rate their level of agreement with the statement: "I am concerned that visual information about the COVID-19 pandemic is being shown on the television and that this information is not accessible to me." Of the participants who rated this statement more females (33%) than males (19%) expressed they agreed or strongly agreed and those 55 years and older had the highest concern (21%) among the three age categories. Participants with a congenital vision loss (31%) had greater concern than those with a childhood vision loss (8%) or vision loss during adulthood (13%). This statement was of higher concern to those who were blind (37%) compared with those with low vision (15%). There was a slightly higher level of concern for participants who did not have an additional disability (28%) compared with those who did have an additional disability (24%).
Use Of Technology Tools, Apps, and Programs
Most participants reported at least five different ways they were accessing information about COVID-19. The top response was local television news (n=1,276), followed by national television news (n=1,158), news websites (n=1,049), family and friends (n=1,034), and social media (n=965).
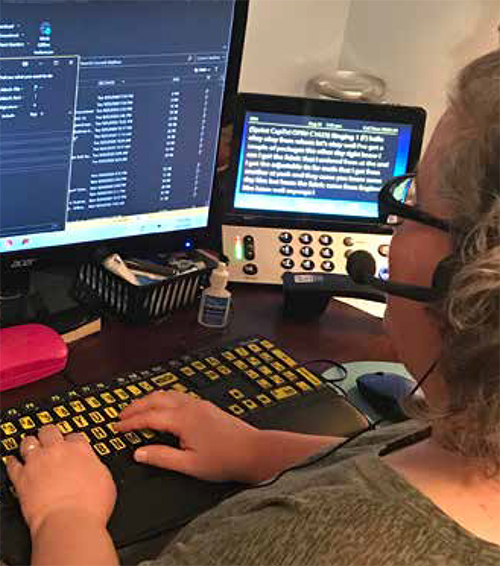
In their daily lives, participants reported using a wide range of technology tools and apps/programs. The top three technology tools most often used by participants were iPhones (n=1,563), laptop computers (n=1,269), and smart speakers, such as an Amazon Echo or Google Nest (n=1,010). The top three categories of apps/programs participants reported using were email (n=1,810), social media tools (e.g., Facebook, LinkedIn, and Twitter) (n=1,395), and conferencing tools (e.g., Zoom and Google Hangouts) (n=1,278).
Participants were asked to rate their level of agreement with the statement: "As a result of the COVID-19 pandemic, I have increased my use of apps designed to connect people with visual impairments with sighted assistance (e.g., Aira, Be My Eyes)." Of the participants who rated this statement more females (17%) than males (9%) expressed they agreed or strongly agreed. Participants with a congenital vision loss (16%) had greater concern than those with a childhood vision loss (4%) or vision loss during adulthood (5%). This statement was of higher concern to those who were blind (20%) compared with those with low vision (6%). There was a slightly higher level of concern for participants who did not have an additional disability (14%) compared with those who did have an additional disability (11%).
I've added multiple news source information to my [news digest] on my Echo device to obtain more information about COVID-19.
—Congenitally VI Hispanic female, aged 25–34 years, with no additional disabilities
For some participants, as a result of COVID-19, the manner in which visual-interpreting services were being used was changed. Some participants reported using these services to verify the location of items delivered to their homes and left by drivers, to read and enter CAPTCHA information on websites, and to read information such as expiration dates on food products or directions on bottles.
[M]y usage of social media tools has changed. I use them to connect with others who have shared interests via groups to help maintain my mental health due to quarantine/social distancing guidelines and requirements.
—Congenitally VI White male, aged 25 to 34 years, with no additional disabilities
Social Connections Using Technology
Technology allowed participants to connect with others known to them prior to the COVID-19 pandemic and others they had met as a result.
When an individual identifies with others who share a similar characteristic, such as those who are visually impaired, some individuals find it helpful to connect with others who share the same identity. There were 808 participants who reported they reached out to other visually impaired individuals in their personal networks for support related to COVID-19. An almost equal number, 785 participants, did not reach out to any organized group for support or information. For those participants who did reach out to one or more groups, 412 found support from social media groups, 399 sought support from consumer organizations (e.g., American Council of the Blind, Blinded Veterans Association, Foundation Fighting Blindness, National Federation of the Blind, National Organization of Albinism and Hypopigmentation), 254 connected with support group members, and 125 reached out to vocational rehabilitation agencies.
It is important for the blind community to support each other to give us the strength to help us get through these challenging times.
—Congenitally VI Hispanic female, aged 25 to 34 years, with no additional disabilities
Recommendations
The inaccessibility of websites, apps, and graphical information has made obtaining information during the pandemic challenging for those with visual impairments as many workplace, retail, educational, social, and health interactions have moved online to prevent person-to-person disease spread. People who are blind or have low vision have long advocated for digital inclusion, and the pandemic has only served to heighten this need.
- Just as emergency alert information on television is required to be presented in accessible formats, critical public health information must also be accessible to people who are visually impaired. Therefore, any government agency distributing information about the coronavirus should provide equivalent levels of access to people who are visually impaired. The Section 508 guidelines provide clear directions to the Federal Government while states can and should use accepted standards, such as the W3C Web Content Accessibility Guidelines6, to design and implement digital information and services.
- Information presented in graphical form, such as maps and bar graphs need to be provided with text equivalents. For example, images can be provided with text alternatives through alt attributes, and graphs can be provided with tables presenting the equivalent data with text descriptions of any trends apparent from the graph. All graphics in this report have alternative text to ensure accessibility by those who are visually impaired.
- Product developers should incorporate digital accessibility into products as the products are initially being developed. Grocery delivery services, internet communications platforms, and telehealth should adhere to accepted standards such as the W3C WCAG, in order to remove access barriers for those who are visually impaired.7
- Provision should be made for visual interpreting services, such as Aira and Be My Eyes, to ensure that people with limited financial resources can take advantage of these services.
- Employees or volunteers of visual interpreting services need training so they are effective in providing users with necessary and unbiased information.
5. The mean (M) is derived by averaging the participants' ratings, strongly disagree (1) to strongly agree (5). The larger the standard deviation (SD) the greater the spread from the mean of the participants' ratings.
6. See https://www.w3.org/WAI/standards-guidelines/wcag.
7. See https://developer.android.com/guide/topics/ui/accessibility/apps and https://developer.apple.com/accessibility/ios.