Flatten Inaccessibility: Introduction
We keep thinking we can outwit this thing, and that things will "go back to normal." Let's overwrite 'normal' and use this opportunity to make it BETTER for us.
—Congenitally VI White female, aged 45 to 54 years, with additional disabilities
The coronavirus disease 2019 (COVID-19) pandemic presents an opportunity for those who are visually impaired, policymakers, industry leaders, consumer organizations, and others to understand and reduce the challenges in the lives of adults who are blind or have low vision. Some of the challenges experienced by those who are visually impaired are unique to the pandemic, yet others bring to the forefront systemic inequalities that have been recognized by those with vision loss for many years. This pandemic presents a unique opportunity to examine the effect of vision loss and to effect change to ensure full access within all facets of life for Americans who are visually impaired, including those who have additional disabilities or health challenges.
Conceptualized during the last week of March 2020, the Flatten Inaccessibility survey sought to answer a simple question:
How has the COVID-19 pandemic affected the lives of adults with vision loss in the United States?
The COVID-19 pandemic began to affect Americans in late February 2020. The survey began on April 3 and closed on April 13, 2020; therefore, this survey was conducted in the early stages of the U.S. response to COVID-19. According to the U.S. Centers for Disease Control and Prevention, as of September 9, 2020, there have been 6,310,663 confirmed cases and 189,147 total deaths due to COVID-19.3. However, when this survey was disseminated, only 257,986 people in the United States had tested positive for COVID-19 between the week of March 1, 2020, and the week of April 4, 2020. In this same period, there were 13,686 COVID-19–related deaths. Thus, although COVID-19 was affecting Americans' lives, numbers were not high compared with early September 2020 when the Flatten Inaccessibility report was being finalized. Readers should keep this information in mind as they view this report. It is probable if the survey were conducted again in September 2020, for example, that more participants would have indicated concerns about the effect of COVID-19 on their lives.
Data for the Flatten Inaccessibility survey were collected through an accessible, online survey on a dedicated website: flatteninaccessibility.com. At the end of the survey, participants were given the opportunity to provide their email address to be entered into a drawing for 20 Amazon gift cards, each valued at $20. After careful review of the data, 1,921 U.S. participants and 39 foreign participants (n=1,960) completed the survey. Because we only analyzed the responses that came from individuals in the U.S., 1,921 surveys were included in the final analysis. This report presents this data and recommendations based on the study findings.
Participant Recruitment
The 1,921 participants who took part in the Flatten Inaccessibility survey may not be representative of the general U.S. population who are visually impaired. The participants identified predominantly as White (77%), female (63%), and older (44% were over the age of 55 years). Additionally, important groups who have different experiences, such as individuals who identify as Black, Hispanic, Asian, and nonbinary, are not fully represented in this study sample. In the future, researchers in the blindness field must engage more diverse populations to have a more representative sample.
Also, because the survey was available online and advertised primarily through email and social media outlets, individuals who were not online or connected with one of the 16 organizations and companies that collaborated to advertise the survey may have missed the opportunity to participate. However, the study sample does provide a snapshot of how the COVID-19 pandemic was affecting a group of visually impaired individuals throughout the U.S. during the first half of April 2020. The data gathered from the participants not only highlight challenges related to COVID-19, but also provides documentation of the systemic issues those who are visually impaired encounter on a daily basis. Further, through the experiences that participants shared, the researchers have highlighted recommendations that can be valuable in shaping the lives of those with vision loss today and in the future.
Survey Design and Analysis
A group led by Dr. L. Penny Rosenblum, AFB's director of research, developed the survey. Using JAWS, NVDA, and VoiceOver, the survey was checked for accessibility. Participants could choose which of the 11 sections and 171 questions they answered. The 11 sections of the survey included:
- About You
- About Your Technology Use
- Healthcare
- Transportation
- Employment
- Current Education Experience
- Children You Are Supporting in K12 Education
- Your Social Experiences
- Access to Food, Meals, and Needed Supplies
- Voting
- Final Questions
Quantitative data were analyzed using descriptive statistics. The qualitative data gathered through open-ended questions were reviewed by two coders who identified themes within each survey section.
Demographic Variables and Concern Statements
To aid in analysis and interpretation of the participants' responses, the researchers created six demographic variables as explained below:
- Gender (male, female, other): Participants identified as female, male, transgender, nonbinary, nonconforming, or other, with the latter four categories collectively referred to as "other" in this report unless the participant specifically provided their gender identity. There were 15 participants who preferred to not disclose their gender identity and 9 participants who did not select an answer choice.
- Race/ethnicity (White, Black, Indigenous, People of Color): Only participants who identified as White were classified as White; all participants who selected other racial/ethnic groups were collectively classified as Black, Indigenous, People of Color (BIPOC). There were 62 participants who did not select an answer choice.
- Current age (18–34 years, 35–54 years, 55 years and older): Participants were asked their age range with eight options, including "prefer not to disclose." These age ranges were then collapsed to create the three final age ranges. There were 11 participants who did not disclose their age range.
- Age at onset of visual impairment (congenital, child-onset, adult-onset): Participants were asked to select the age range in which they became visually impaired. There were 10 options, including "prefer not to disclose." These nine age ranges were then collapsed to create the three final age ranges. There were 20 participants who did not disclose the age range in which they became visually impaired.
- Level of vision (blind, low vision): There was no survey question that specifically asked participants if they considered themselves to be blind or to have low vision. To create this variable, the researchers took participant answers to the question, "How do you access a computer, smartphone, and/or tablet?" and used participants' responses to create the level-of-vision variable. Participants who said they used screen reader software (e.g., JAWS, VoiceOver) and/or a refreshable braille display were coded as blind. Participants who used screen magnification software (e.g., ZoomText), a combination of screen reader and screen magnification software, built-in features on the device (e.g., enlarged font, reverse contrast), or reported they made no changes to the manufacturer's settings were recoded as low vision. There were 187 participants who did not answer the question used to create the level-of-vision variable.
- Presence of an additional disability (yes, no): Participants who reported at least one additional disability were coded as "yes" and those who did not report any additional disabilities were coded as "no." There were 42 participants who did not answer the question used to create the presence of an additional disability variable.
With the exception of the About You, Voting, and Final Questions sections, each section comprised between 2 and 17 concern statements. Participants were asked to select their level of agreement with the concern using the ratings "strongly disagree" (1), "disagree" (2), "neither agree nor disagree" (3), "agree" (4), or "strongly agree" (5). Participants also had the option to select "not applicable to me." Concern statements that had under 299 participant responses are not shown in tabular format by demographic variables; however, these data are provided in the narrative for the entire number of participants who selected a response between (1) and (5). Data of participants who did not disclose or who did not answer the demographic question are not included in the concern tables. When provided, their data are included in all other quantitative data presented in the report.
The researchers understand that the experience of each of the participants who chose "other" as their gender identity have sexual and biological identities that can vary from that of others. Given our comparatively low sample of the "other" gender subgroup, we believed the reliability of these data could misrepresent the experiences of individuals who identified as transgender, nonbinary, nonconforming, or other. Therefore, the 26 participants who selected "other" for gender are not included in the concern tables. Some quotes in the qualitative data were selected to provide snapshots of specific experiences reported by those in the "other" gender subgroup and also of those from the BIPOC subgroups.
The Importance of the Recommendations
After presenting data for each study topic, relevant recommendations based on the study findings are provided. These recommendations share best practices for businesses, consumer organizations, professionals working with adults who are visually impaired, and policymakers. It is the intent of the researchers that the recommendations will lead to changes that will positively impact the lives of those who are visually impaired.
We absolutely know that not driving is the reason we had to relocate during this pandemic. We don't trust the bus and having to touch everything on it and its limited service. Uber has been more costly. Access a Ride extremely limited their services. However, since we can't go to the store and get a shopping assistant anymore, it doesn't matter so much that we can't drive. ... We talk every day about how disadvantaged we are for not being able to drive ... in this situation.
—Congenitally VI White female, aged 45 to 54 years, with additional disabilities
Participants' Demographic Information
The 1,921 participants resided in all 50 U.S. states, the District of Columbia, and Puerto Rico. The states with the highest number of participants were California, Texas, and New York.
Using 2010 U.S. Census Data4, participants who provided their zip code were classified into one of three communities: - Urban: 50,000 or more people - Urban Cluster: At least 2,500 and less than 50,000 people - Rural: All areas not included in urban or urban cluster areas.
Zip code data were available for 1,840 participants: 32 rural, 301 urban, and 1, urban clusters. Puerto Rico had one participant and is not shown below.
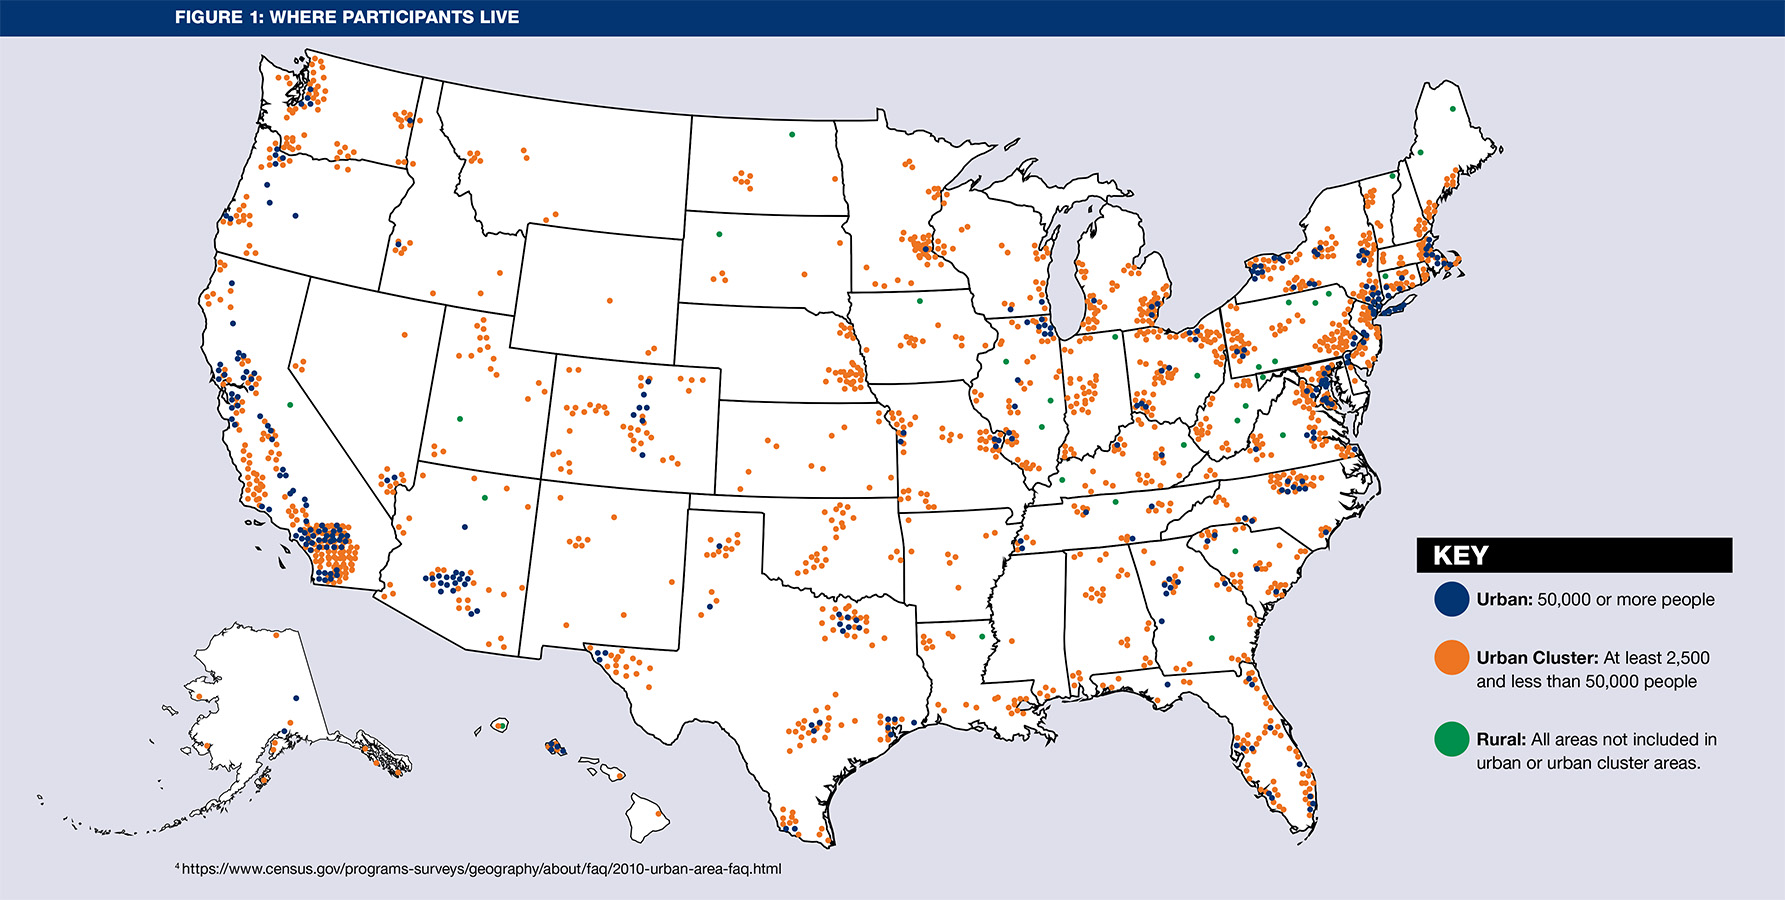
Table 1 reports the demographic characteristics of the participants for gender identity, race/ethnicity, age range, age of onset of visual impairment, level of vision, and presence of additional disabilities. The study sample was predominately White (77%, n=1,427), female (64%, n=1,202), and older (43%, n=807). Additionally, 60% (n=1,117) of participants were congenitally visually impaired, and just over half (57%, n=1,064) reported not having any additional disabilities.
Participants were allowed to select multiple choices that described their living arrangement, 640 participants lived alone, 828 lived with a partner, 292 lived with other family members, and 172 did not provide information about their living arrangements. Only 153 participants reported they had changed their living arrangement or where they lived due to COVID-19, though they were not asked to give a reason for the change. Some participants shared comments that suggested they changed their living arrangement in order to have access to transportation, to not be alone, to have others to assist them, and/or to have access to shopping or to have someone to shop for them.
Recognizing that COVID-19 is especially dangerous for those who have underlying health conditions, participants were asked to self-identify if they had other disabilities or health conditions. Diabetes, hearing impairment, and significant psychiatric disorders were the most frequently reported other disabilities or underlying health conditions.
Deafblindness, the combined effect of a hearing and visual impairment, presents communication challenges under normal circumstances. For those who are deafblind, COVID-19 presents unique barriers to communication, especially with the need to social distance.
10 Most Frequently Listed Additional Disabilities by the Participants
More than 40% (n = 781) of participants reported having at least one additional disability or underlying health concern. Participants were provided a list of health concerns and asked to select all that applied to them. The 10 most frequently reported additional disabilities or underlying health concerns are listed below from highest to lowest frequency.
- Diabetes
- Deaf/Hard of Hearing
- Psychiatric disorder
- Nervous system disorder
- Pulmonary or respiratory condition
- Mobility/physical impairment
- Heart disease
- Compromised immunity
- Suppressed immunity
- Epilepsy/seizure disorder
Deaf-blindness is isolation enough. Without face-to-face and tactile communication, I might as well be in solitary confinement.
—Congenitally VI White female, aged 45–54 years, with additional disabilities
3. https://www.cdc.gov/coronavirus/2019-ncov/covid-data/covidview/past-reports/04102020.html
4. https://www.census.gov/programs-surveys/geography/about/faq/2010-urban-area-faq.html