Access and Engagement II: The Children
Access and Engagement II: The Children
I don’t think she’s receiving the full education she needs. Everything is being taught directly from the books. We only do Google Meeting for 30 minutes a day with her teacher. Everything is put in our hands to teach them. —Native American female family member of a child who has low vision with additional disabilities, 8 to 10 years
Family members were asked to select one of the following four statements that best described their child’s characteristics:
- My child is blind (cannot see more than light and large objects) and has no other learning and/or medical challenges.
- My child has low vision (some usable vision) and no other learning and/or medical challenges.
- My child is blind (cannot see more than light and large objects) and has other learning and/or medical challenges (e.g., a hearing impairment, motor delays).
- My child has low vision (some usable vision) and/or medical and/or other learning challenges (e.g., a hearing impairment, motor delays).
Family members provided information for 206 children. There were 16 (7.8%) children in early intervention, 22 (10.7%) preschoolers, and 168 (81.6%) school-age children. The bar graph below shows the number of children by child-descriptive characteristic in each group. The percentage of children with additional disabilities was 57%.
This percentage was 1% point different from that reported by Rosenblum et al. (2020) in the first Access and Engagement report.
Children Receiving Early Intervention Services
It has been wonderful to continue to receive services virtually, as it’s not safe to do so in person. It has been a lot to take on facilitating the virtual sessions. I feel like I have to plan and prepare relevant activities, keep my child engaged and not distracted by her sibling, and keep the camera on my child as she moves a lot. I feel like I am doing a lot of work to support my daughter’s success and much of the feedback I receive from staff at the end of sessions is about what to do better next time. While I definitely want to continue to support my child to grow, sometimes it feels like I’m never doing enough. —White female family member of a child with low vision with additional disabilities, 1.5 to 2 years old
Family members of 16 children receiving early intervention completed the survey. One child (6%) was under 1 year of age, 4 (26%) children were between 1 and 2 years of age, and 11 (69%) children were over 2 years. Two (12%) of the children were blind, 3 (19%) had low vision, 3 (19%) were blind with additional disabilities, and 8 (50%) had low vision with additional disabilities.
Of the 16 children, 9 (56%) were reported by family members to have an IFSP that had been reviewed or updated within the last 6 months, 2 (13%) had an IFSP but the team had not met to review it in the past 6 months, 2 (13%) did not have an IFSP, and 3 (19%) family members were not sure if their child had a current IFSP.
Current Early Intervention Services
[My] major concerns are that virtual learning has not been effective or engaging for my daughter. She doesn’t connect with what is happening on the screen. Overall, it feels as though we have had a lack of services. —White female family member of a child with low vision with additional disabilities, 2.5 to 3 years old
Fourteen (88%) of the 16 children and family members had received early intervention services in the spring prior to the pandemic. Thirteen family members reported their child and family were currently receiving early intervention services. The family members reported that 5 (38%) children received services once a week, 3 (23%) children received services twice or more a week, 2 (15%) children received services once every 2 weeks, 1 (8%) child received services once a month, 1 (8%) child received services less than once a month, and the service delivery for 1 (8%) child did not fall into any of the provided categories.
The family members were asked about how early intervention services were currently delivered, with 13 family members selecting one or more ways their child’s early intervention team supported them including:
- Conducting meetings online using web conferencing tools (e.g., Zoom) (n=10)
- Sending informational resources (n=6)
- Recommending websites, videos, or other online resources specific to children with visual impairments (n=5)
- Conducting meetings via telephone (n=4)
- Sending ideas and activities via email (n=4)
- Mailing or delivering toys or materials to the home (n=4)
- Meeting in person in the same physical space (n=4)
When asked about their participation in early intervention meetings since the start of the 2020-2021 school year, 13 family members selected their family’s level of participation. Eleven (85%) family members reported their family attended almost all sessions, and 2 (15%) family members reported they made an effort to attend most sessions.
Seven family members reported meetings with early intervention staff in the same physical space, with 2 (15%) family members reporting meetings inside the home, 1 (7%) reporting meetings outside of the home such as on the porch or in the backyard, 1 (7%) reporting meetings in a building such as a school, and 3 (23%) reporting meetings online. Four family members reported that both they and early intervention providers used COVID-19 safety precautions when meeting in person.
Regardless of where early intervention services were delivered, most family members reported feeling overwhelmed, especially as they needed to juggle multiple roles. Some family members were concerned their child would regress as the pandemic continues longer than anyone expected.
She receives O&M services. She gets OT and TVI only virtually. We meet bi-weekly rather than the weekly we had before COVID. My older daughter used to be at school during my EI kiddo’s sessions, but now she’s home so I have to juggle a FaceTime call, my toddler, and my high-needs older child all at once. I’m tired all the time from dealing with pandemic-related childcare insecurity, work-from-home challenges, lack of safe transportation, and health concerns. So even when my team has a useful tip for me, I can barely process it because I’m in survival mode. Plus, my daughter and I both learn so much better in person, and that hasn’t been available for months and months. —White female family member of a child with low vision with additional disabilities, 2.5 to 3 years old, and a child with low vision with additional disabilities, 4 years old
Family members were provided six statements and asked to rate their level of agreement with each statement. The number of participants rating the statement, the mean, and the standard deviation are reported in Table 7.
Table 7: Early Intervention Family Members’ Ratings of Statements About Services
| Statements | n | M7 | SD |
|---|---|---|---|
| I believe the benefits of early intervention services in person outweigh the risks of potential exposure to COVID-19 for my child. | 4 | 3.50 | 0.58 |
| I believe the benefits of early intervention services in person outweigh the risks of potential exposure to COVID-19 for me or others who have regular contact with my child. | 4 | 3.50 | 0.50 |
| I am an effective member in my child's early intervention team because I am completing activities with my child and using strategies the educational team members share with me. | 16 | 3.50 | 1.10 |
| I am satisfied with the level of communication I currently have with my child's early intervention team. | 16 | 3.00 | 1.10 |
| I am satisfied with the level of support I currently have from my child's early intervention team. | 16 | 2.94 | 1.10 |
| I believe my child is making developmental progress in the same way they would if there had not been a COVID-19 pandemic. | 16 | 2.75 | 1.10 |
The four family members who reported their family was receiving in-person early intervention services had a high level of agreement with the benefits of these services outweighing the COVID-19 risks. Though closer to "Agree" than "Disagree," there were some family members who had concerns about their child’s developmental progress and the level of support they were being provided by members of the early intervention team. Agreement was high among family members who reported they felt a part of the early intervention team and had effective communication with early intervention team members.
Children In Preschool Programs
We opted for virtual due to health concerns...The special education teacher is brand new and has had trouble adapting the course delivery...for our daughter. Our TVI has been amazing but the school/special ed teachers are lagging way behind. They think reading to her over Zoom [about] an abstract concept about a farm voting for a duck for social studies will educate about "General elections"...having her repeat a phrase back means nothing. We have really struggled with this and the school despite multiple meetings. And we are so frustrated! —White female family member of a child with low vision, 5 years old
Family members of 22 children enrolled in preschool programs completed the survey. There were 7 (32%) 3-year-old children, 9 (41%) 4-year-old children, and 6 (27%) 5-year-old children. One (5%) of the children was blind, 8 (36%) had low vision, 4 (18%) were blind with additional disabilities, and 9 (41%) had low vision with additional disabilities.
Of the 22 children, 20 (91%) children were reported by family members to have an IEP that had been reviewed or updated within the last 12 months, and 2 (9%) were reported to have an IEP but the team had not met to review the IEP in the past 12 months.
Current Preschool Education
Nine (41%) children and their families had received early intervention services in the spring prior to the COVID-19 pandemic, 12 (54%) children had received preschool services, and 1 (5%) child had not received services. Throughout the United States and Canada, the start of the school year was laden with uncertainty as to when school would start and whether instruction would be in-person, online, or a hybrid delivery model. Of the 22 family members, 16 family members were given a choice of where their child would attend school (e.g., online). Nine family members reported their school administration currently would allow them to change their choice, for example, from in-person to a hybrid model.
There were 21 children who were participating in preschool education at the time the family members completed the survey. The one family member whose child was not participating in preschool education reported the school district was not offering an accessible option. The family member indicated in a follow-up question that the child was homeschooled.
The 22 children enrolled in preschool were receiving their education in multiple ways:
- In a preschool class for children with varying disabilities held at a public school (n=7)
- In a preschool class with typically developing peers with TVI and/or O&M specialist instruction (n=4)
- In a preschool class at a school for the blind (n=5
- In a preschool class at a daycare, faith-based, or other private school (n=2)
- Homeschool (n=2)
- In a different type of school setting (n=2)
We have been able to dedicate more time to independent learning skills with the slower pace. She has become potty trained, and she can help get water and ice from the fridge. Still working on putting clothes and shoes and braces on. —White female family member of a child who is blind, 3 years old
Some family members found that changes from an online to a hybrid to an in-person model made it difficult for their child to learn. Though some family members were concerned their child would regress in their skills, a few family members found that during the pandemic, their child’s skills were increasing. For example, there were children who were gaining skills with technology and some who were having an opportunity to build their independence in different areas of the ECC, including independent living skills.
Children Who Are School Age
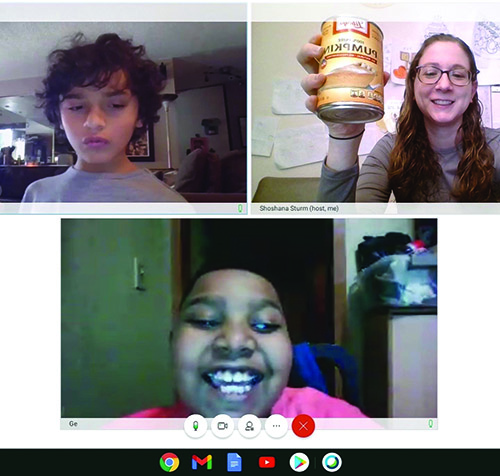
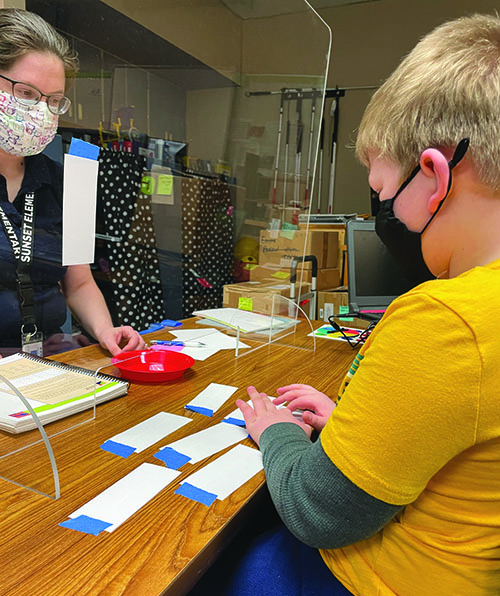
[My] child is attending live virtual classes with peers and teachers. I am serving as the para[professional] when needed. The TVI collaborates with the general ed teachers and reviews materials. She adapts assignments so that they are in an accessible format such as in MS Word. The TVI comes for 2 hours every other day to work [with my child] on independent living skills. We also do in-person community O&M 1 hour a week and receive virtual technology training 4 hours a week from a TVI who specializes in technology. This setup is working well as I am more involved and better able to properly support my child than the in-school para[professional] was. Meaning I know what is accessible and what is not, and I know how to properly support my child, so she is becoming more independent with her academics, time management, organization and such. She has grown much more independent while receiving instruction this way with proper support. It has helped that teachers give all students an outline for [the] weekend before everything that will be worked on for the upcoming week. This has allowed my child to review and be prepared for class and to complete some assignments the night before which enables her to focus more during class as she is not having to struggle as much through navigating to find her place using [a] screen reader while also trying to listen to instructions or lectures from the teacher. This has reduced stress and enabled better engagement during class for her. —White female family member of a child who is blind with additional disabilities, 16 to 18 years old
One hundred sixty-six family members of school-age children completed the survey. Two of these family members also completed a survey for a second child. Data in this section and throughout the report are provided for the 168 school-age children. There were 27 (16%) 5- to 7-year-old children, 38 (23%) 8- to 10-year-old children, 22 (13%) 11- to 13-year-old children, 44 (26%) 13- to 15-year-old children, 27 (16%) 16- to 18-year-old children, and 10 (6%) 19- to 22-year-old children. Thirty-three (19%) of the children were blind, 43 (26%) had low vision, 28 (17%) were blind with addition- al disabilities, and 64 (38%) had low vision with additional disabilities.
There were 10 (6%) children enrolled in preschool services in the spring of 2020 prior to the pandemic, 146 (87%) children receiving school-age services, and 12 (7%) children not receiving services.
The Impact of Educational Service Delivery Changes
This whole experience with learning online has been a disaster. The information we were given to access classes WAS NOT tested first. [They] had a sighted person using VOICE OVER [provide directions] therefore there were a lot of time that was wasted having to rethink how to access her classes and work. I am sighted and I do not know how to access technology with assistive technology, but it was VERY OBVIOUS that the staff did not take this ESSENTIAL tool in mind. These KIDS ARE BLIND! —White female family member of a child who is blind with additional disabilities, 16 to 18 years old
As it was for families of younger children, the start of the school year was full of uncertainty. When asked if they were given a choice of where their child would attend school (e.g., online), 119 (71%) of 168 family members reported they were given a choice. Seventy-six (64%) family members reported their school administration currently will allow them to change their choice, for example, from in person to hybrid. It was clear from family members’ comments that there was a lot of frustration about options available to their child and the impact of the delivery model on their child’s access to education.
We would like to work with a TVI that would adapt our son’s lessons. I think it would be helpful to the special ed teacher and the whole team. They are struggling to put a program together for our child. Our child is frustrated because things aren’t adapted. —Female family member of a child who has low vision with additional disabilities, 16 to 18 years oldOf the 168 children, 154 (92%) were reported by family members to have an IEP that had been reviewed or updated within the last 12 months. Four (2%) children had an IEP that had not been updated, 6 (4%) did not have an IEP, and 3 (2%) had a 504 Plan. One family was unsure if their child had an IEP or 504 Plan.
There were 160 (95%) children who were currently participating in education through a school district, specialized school, or other educational agency. Eight (5%) children were either being homeschooled by the family previously or were now being homeschooled because the family member reported there was not a viable school option being offered by the district.
One hundred fifty-nine family members reported that 48 (30%) children were enrolled in general education classes receiving TVI and/or O&M services, 35 (22%) were in a combination of general and special education classes with TVI and/or O&M services, 24 (15%) were in a public school special education classroom with TVI and/or O&M services, 31 (19%) were at a specialized school, 6 (4%) were attending a center-based program for children with varying disabilities with TVI and/or O&M services, 10 (6%) were at a charter or private school with TVI and/or O&M services, and 5 (3%) were homeschooled possibly having TVI and/or O&M services.
The COVID-19 pandemic caused educational teams to have to make adjustments in the service time and goals for students in addition to the ways in which services are delivered. In some instances, opting for in-person instruction was viewed by family members to outweigh the risks from the virus.
My son’s school is 100% virtual, but we are meeting in person with the TVI for braille instruction and the O&M [specialist], since we have found these services difficult to benefit from online. —Female family member of a child who has low vision with additional disabilities, 5 to 7 years oldIn spite of the changes in their IEPs in the educational and related services they receive throughout their schooling, for many students, there is continuity both within a school year and from year to year. Table 8 reports the number of students receiving services at three points in time. Though it is probable some changes were not due to the pandemic, the deep decline in services from before the pandemic to during the pandemic is telling. On the positive side, by November 2020, many more students were receiving services than during the start of the pandemic. For example, there was a 52% drop in the number of children receiving physical therapy initially; nine months into the pandemic, the same number of children were receiving physical therapy as there were before the start of the pandemic.
Table 8: Frequency of School-Age Children Receiving Educational Services from Educational Professionals at Three Points in Time
| Before the Pandemic (Before March 2020) | At the Start of the Pandemic (March 2020) | Currently (November 2020) | |
|---|---|---|---|
| TVI | 125 | 92 | 136 |
| O&M specialist | 112 | 55 | 107 |
| General education teacher | 125 | 101 | 117 |
| Special education teacher | 93 | 75 | 89 |
| Paraprofessional | 93 | 41 | 84 |
| Physical therapist | 50 | 26 | 50 |
| Occupational therapist | 70 | 37 | 62 |
| Speech therapist | 65 | 37 | 65 |
| Adapted physical education teacher | 36 | 9 | 9 |
| Nurse | 31 | 8 | 19 |
| Transition specialist | 25 | 14 | 20 |
| Behavior interventionist | 20 | 7 | 17 |
| Teacher of the deaf/Hard of hearing | 11 | 8 | 9 |
7. The mean (M) is derived by averaging the participants’ ratings—from “Strongly disagree” (1) to “Strongly agree” (4). The larger the standard deviation (SD), the greater the spread from the mean of the participants’ ratings.